
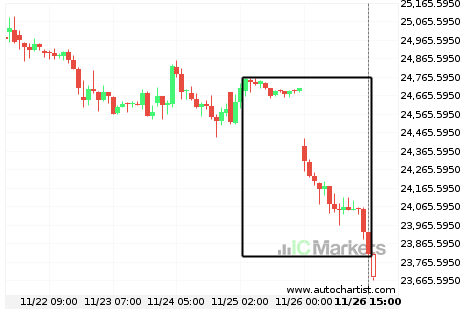
Huge bearish move on Hong Kong 50 Index
Hong Kong 50 Index has moved lower by 3.8% from 24,685.5 to 23,809.8 in the last 2 days.

Huge bearish move on Hong Kong 50 Index
Hong Kong 50 Index has moved lower by 3.8% from 24,685.5 to 23,809.8 in the last 2 days.
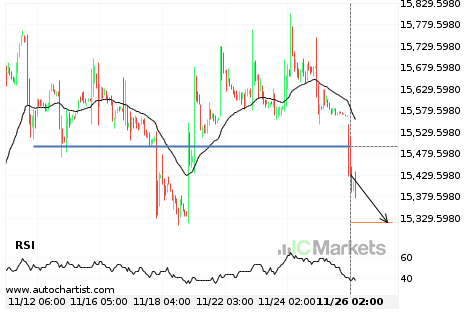
Possible start of a bearish trend on FTSE China A50 Index
FTSE China A50 Index has broken through a line of 15495.6699. If this breakout holds true, we could see the price of FTSE China A50 Index heading towards 15319.7354 within the next 2 days. But don’t be so quick to trade, it has tested this line numerous times in the past, so you should probably […]

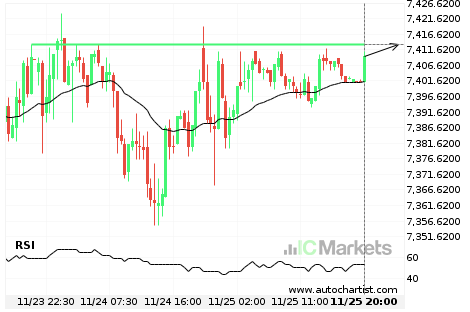
Australia 200 Index – getting close to psychological price line
Australia 200 Index is moving towards a resistance line. Because we have seen it retrace from this level in the past, we could see either a break through this line, or a rebound back to current levels. It has touched this line numerous times in the last 3 days and may test it again within […]
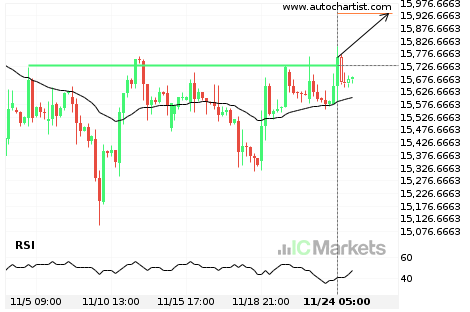
FTSE China A50 Index broke through important 15729.0801 price line
FTSE China A50 Index has broken through a resistance line. It has touched this line numerous times in the last 20 days. This breakout shows a potential move to 15934.9531 within the next 3 days. Because we have seen it retrace from this level in the past, one should wait for confirmation of the breakout.

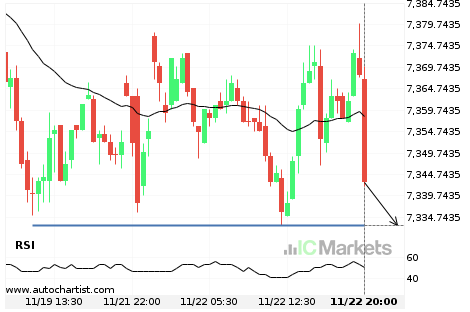
A final push possible on Australia 200 Index
Australia 200 Index is heading towards 7375.3301 and could reach this point within the next 2 days. It has tested this line numerous times in the past, and this time could be no different, ending in a rebound instead of a breakout. If the breakout doesn’t happen, we could see a retracement back down to […]

Either a rebound or a breakout imminent on FTSE China A50 Index
FTSE China A50 Index is heading towards a line of 15577.5000. If this movement continues, the price of FTSE China A50 Index could test 15577.5000 within the next 2 days. But don’t be so quick to trade, it has tested this line numerous times in the past, so this movement could be short-lived and end […]
Australia 200 Index – getting close to psychological price line
Australia 200 Index is moving towards a support line. Because we have seen it retrace from this level in the past, we could see either a break through this line, or a rebound back to current levels. It has touched this line numerous times in the last 4 days and may test it again within […]